Using Plausible APIs, Charty for iOS and Apple Shortcuts to Build a Widget for Plausible Analytics
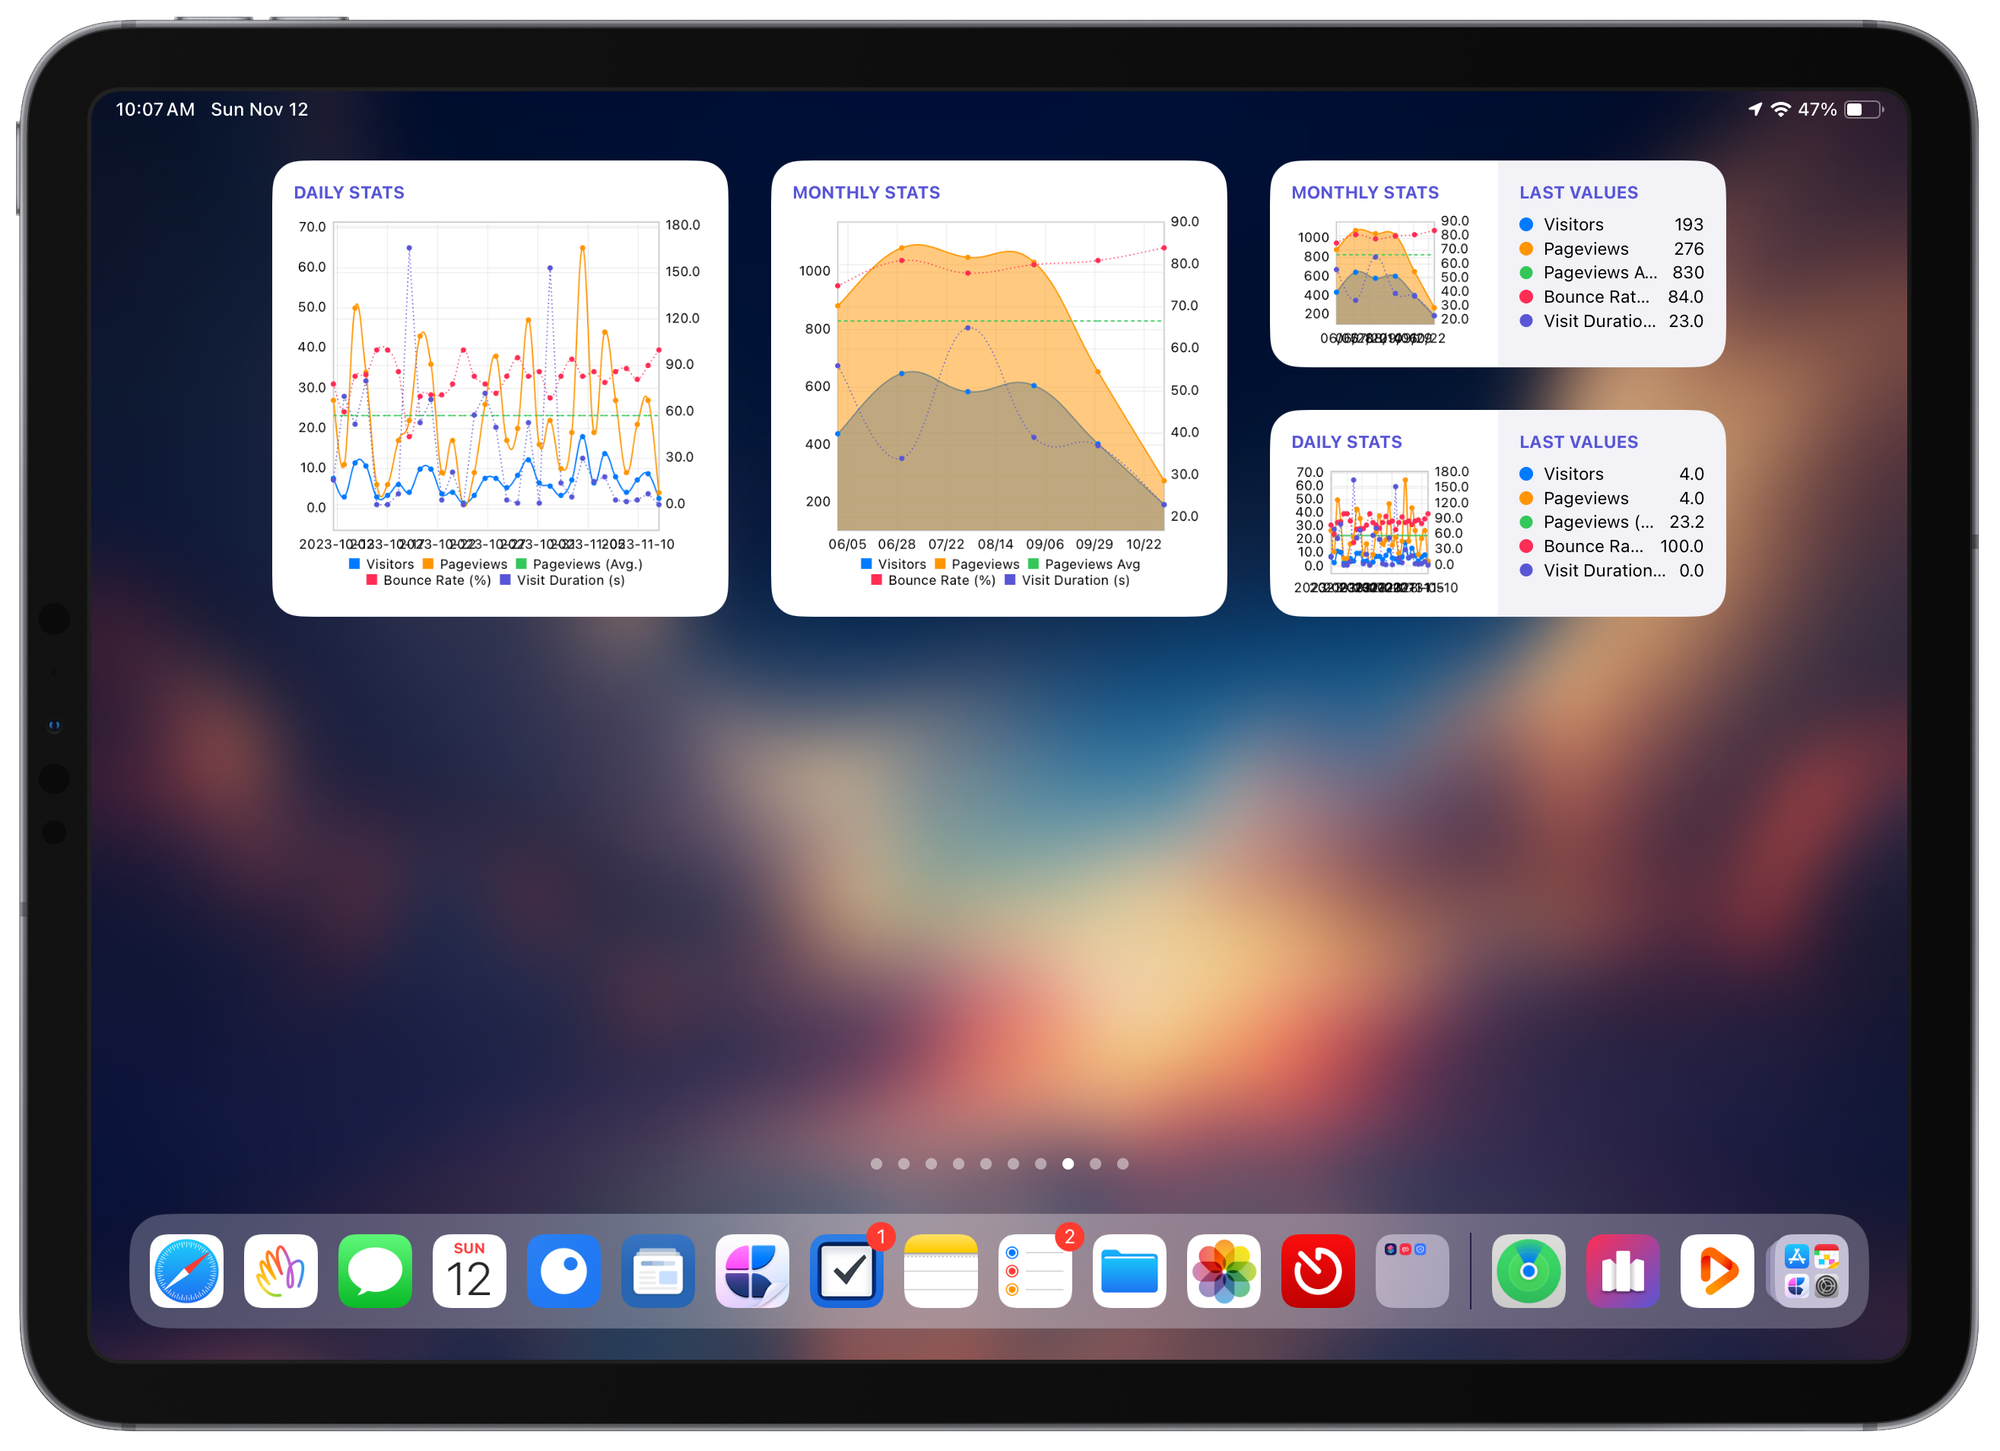
Here’s an overview of the required building blocks to build Plausible Analytics widgets for the iPhone.

I want to share something with you, dear readers. I’m obsessed with numbers, statistics and dashboards. I have always paid attention to my website visitor analytics trends. One of the first things I did when my blog was hosted on WordPress was to create a Google Analytics account and link it to my website to measure its popularity or attraction. I remember constantly looking for iPhone apps that could connect to my Google Analytics account and display the numbers in a beautiful way. There weren’t a lot of apps, but I remember one called GAget, where the presentation was absolutely beautiful (this was eventually discontinued).
Today, many things have changed. I no longer use Google Analytics (here is why); instead, I use Plausible Analytics. However, one thing remains constant: every morning, I first check my Plausible analytics dashboard (which is public, by the way). While I don't mind not having a million visitors per day, I obsess over the trends, where visitors are coming from, what page they visit the most, etc. It's fun. That's why I'm subscribing to Plausible. The issue with this service is the absence of native iPhone apps. It would be great to have visually appealing dashboard graphics on my iPhone.

When Apple announced widgets for the iPhone, one of the things I wanted was to be able to display my Plausible analytics within a big widget on my Home Screen. The required components were a way to query Plausible’s APIs through an Apple Shortcut and display the data in the widget. For this, there is a super and powerful app: Charty for iPhone. All the pieces were there, but they lacked the glue between them.
This summer, I started looking into this. After some research, I saw the following challenges:
- How do I query the APIs from a Shortcut?
- How do I process the response from the API request?
- How do I pass that processed information to Charty to generate a beautiful graph?
Once the data is in Charty, the rest would be easy because Charty supports widgets where you select which graph to display as the widget’s data source.
Sending an API request through Shortcut is relatively simple but requires some googling to learn authentication methods with an API. The more challenging part is the processing of the query reply. Plausible APIs return JSON responses. That was my main roadblock. After much reading about processing dictionaries in Shortcut, I gave up because I couldn’t figure out how.
If you don’t know what a dictionary is in JSON terminology, let’s ask ChatGPT for an explanation: A dictionary in JSON format is a collection of key-value pairs enclosed in curly braces { }. It is a way to organize and represent data. Keys must be strings, and values can be strings, numbers, booleans, arrays, or nested dictionaries.
For example:
{
  "name": "Alice",
  "age": 30,
  "isStudent": false,
  "hobbies": ["reading", "painting"],
  "address": {
    "city": "New York",
    "country": "USA"
  }
}
In this example, "name", "age", "isStudent", "hobbies", and "address" are the keys. Their respective values are "Alice", 30, false, ["reading", "painting"], and another nested dictionary with "city" and "country" as keys and their corresponding values.
I was facing a programming challenge while working with Apple Shortcuts. Although I have experience in computer programming and successfully developed an iPhone app in Objective-C from 2009 to 2013, I struggled with Apple Shortcuts. The shortcut editor is difficult to use, and debugging is nearly impossible. I felt stuck and unable to make progress. Plus, processing nested dictionaries was also a big challenge. It wasn’t and still isn’t obvious to me.
In July, I came across a post on Micro.blog from Jarrod Blundy, who was enthusiastic about creating shortcuts. Jarrod is the author of the excellent HeyDingus website. I asked him if he would like to build a shortcut for me. He agreed immediately, and I gave him all the necessary details to start the project without specifying a deadline.
Jarrod returned to me in early November with several versions of the Shortcut. After downloading them from the provided iCloud links and upon the first execution, I was impressed and enthusiastic with the outcome. The shortcut not only retrieved the data from Plausible efficiently, but Charty also presented the results in a visually appealing line graph. I returned to Jarrod with my appreciative comments and sent him some money as a big thank you.
Two remaining things were needed to finalize the desired solution: setting up a widget on the iPhone and assigning the programmatically created graph as the widget’s data source.
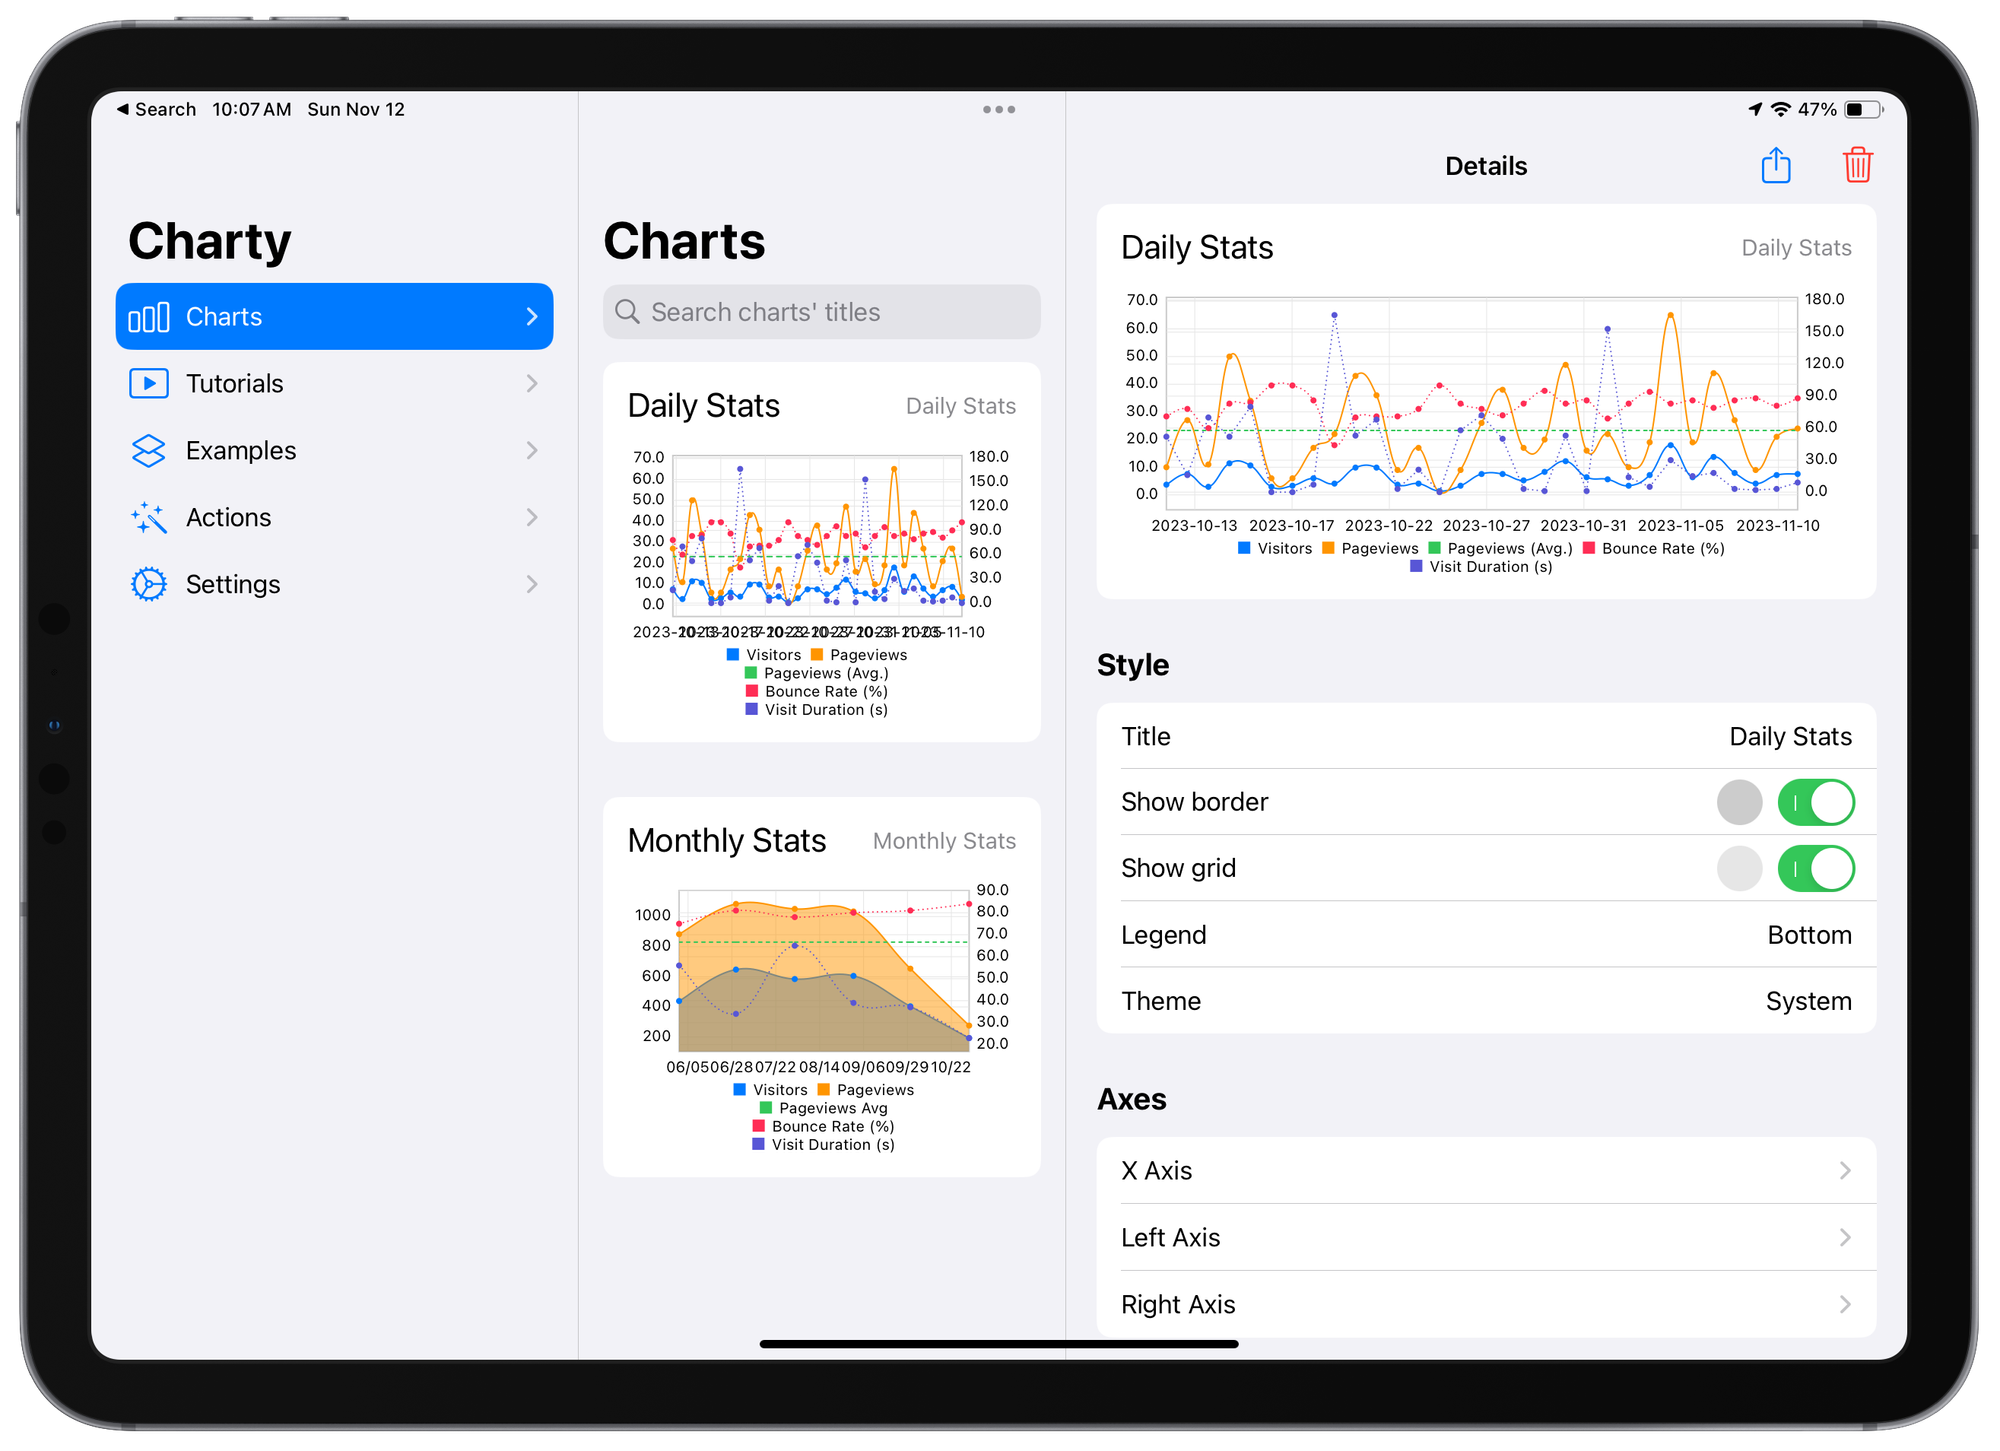
Since receiving the shortcuts, not only have I examined the shortcut’s logic, but I have also made some tweaks to the graph formatting. This is where I discovered how powerful Charty is. The current version of Charty is 1.4 and hasn’t been updated in a while. I checked to see if there were any plans for a new version, and sure enough, it seems the developer is working in Charty 2.0, which would take advantage of new data charting capabilities in Swift, which were announced in WWDC 2022 if I remember correctly. I can’t wait to get my hands on this update.
I added my widgets to my iPhone and on my iPad, even on my Mac mini desktop, thanks to macOS Sonoma. It’s cool! The one last thing was to set an automation on my iPhone to execute the shortcut regularly. The daily stats widget gets updated every morning, and the weekly stats widget once a week, every Sunday. That was pretty easy. But there is another way: with Charty’s widget, you can set an action to execute if the widget is tapped. I could set it up to run the corresponding shortcut. Isn’t this cool enough?
Jarrod’s work on this small project is exemplary. The shortcut logic is straightforward; comments accompany each logical construct of the shortcut to describe what is being accomplished. And the shortcut works! If you have ideas for some projects like this one but are afraid of programming, get in touch with him, and you never know; he might be willing to accept the challenge. Ask him to share the Shortcut to get started if you are on Plausible, too.
I’m a happy camper. 🙂 Now, I should spend some time trying to understand JSON dictionary processing using Shortcuts 🤓