Which Device I Use and for What?
An iPhone, an iPad, a Mac mini, a MacBook Air. Which of these device I use the most, the least. And for what purposes. #blogging #writing
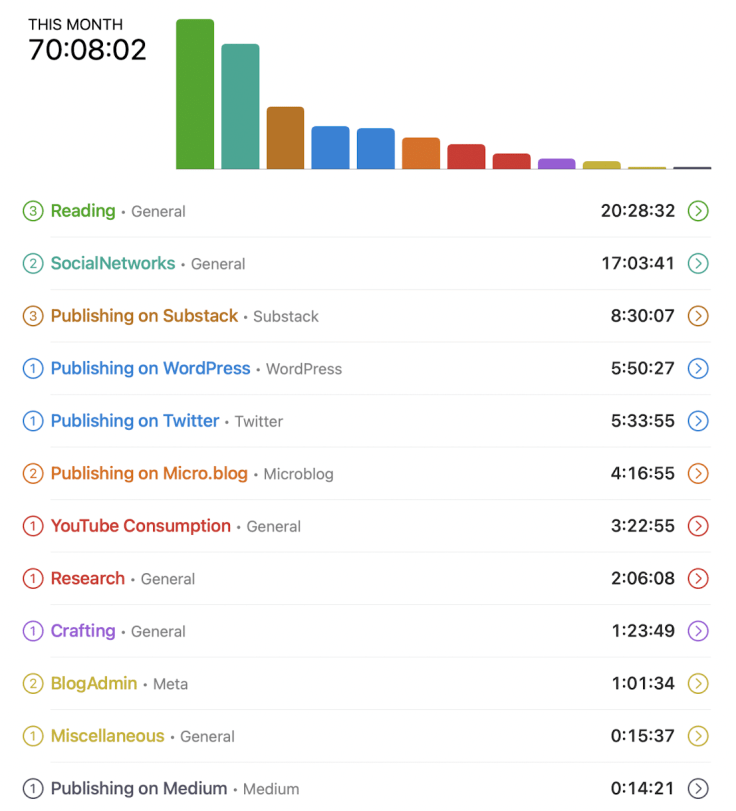
I love statistics and numbers as well as doing some introspection on my habits, my workflows, the tools I use and potential optimizations of them. So here are a few interesting numbers coming out of my time tracking for the month of October of 2021. The following charts are summaries of my tracked time by device type.
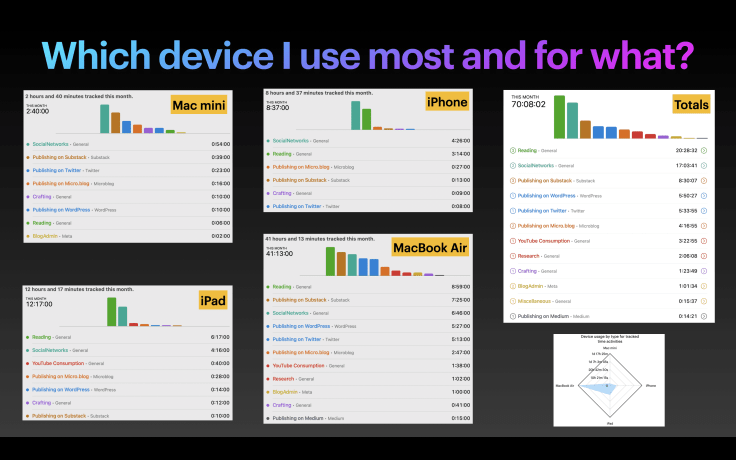
I wouldn’t read too much into these numbers, yet quite a few interesting observations can be drawn from these numbers.
- The MacBook Air is my preferred device for anything (before, it was a split between my M1 Mac mini and my iPad Pro). So, I was right in buying a MacBook Air: read “Coming Out of a Rabbit Hole and Buying Two MacBook Air”.
- The Mac mini and MacBook Air are multi-purposes devices. Consequently, usage is spread out over many tasks and activities where publishing is taking a big portion of the time I spend on these devices.
- My iPhone is often used for Twitter consumption. Surprisingly, I’m also reading quite a lot on the iPhone. Thanks to Matter.
- My usage of the iPhone is low compared to other devices as I’m commuting for my work only once a week. Time spent in public transportation is a prime moment for using the iPhone. But, it’s a thing of the past, it’s the new normal for me.
- The iPad is mostly used for reading and YouTube videos consumption. That’s not really surprising, right?
- I’m probably spending too much time on Twitter and could reduce this if I was more disciplined with my Mailbrew usage.
- About 90% of my time is spent as follow: publishing 35%, reading 30%, and 24% on social networks. The rest of my tracked time is spread among different less important activities.
- The following diagram shows how skewed my tracked time is towards the MacBook Air.
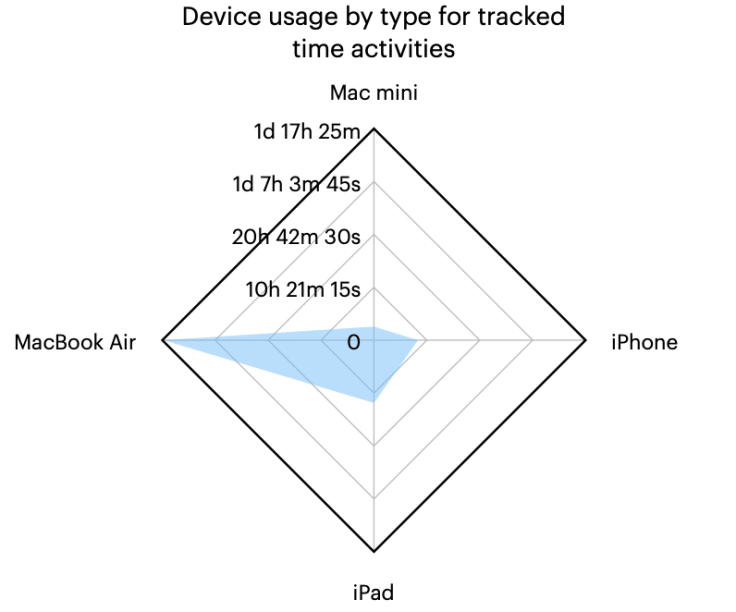
Those numbers were obtained with Toggl and Timery. Please, consider reading how I am tracking my time. Charts were created with release 1.3 of Timery.

